

City Biking Front-to-end Data Analysis
February 2024
Languages & Libraries
Python, Tableau, Pandas, Kaggle
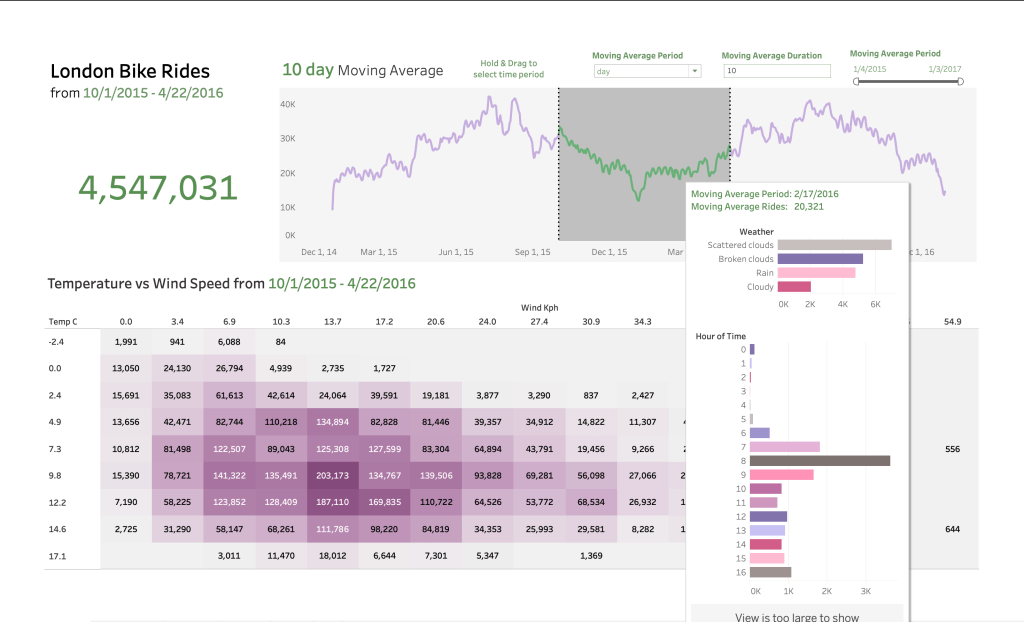
In this project, I wanted to experience a solo front-to-end DS Analysis feature. I first used Kaggle & Pandas to ingest, clean, & analyze the raw data, then used Tableau to build a dashboard with 5 tailorable features to visualize.
Check out the full interactive online version here:
